

Dry January
Every year for the last four (maybe five?) years we have done Dry January or “Joyless January” as Bec likes to call it. We usually go from 2nd January through to my birthday on the 10th February – so technically January and a bit. Although I do it begrudgingly and annoyingly suggest opening bottles of wine every other night I do think it’s a good chance to reset for the new year with a clean slate after the Christmas / New Year period.
I really had no idea how popular Dry January was until I start reading articles the last few years suggesting up to one in five US adults participating. This year I also heard about “Damp January” where instead of abstaining you try and cut back. Great idea.
Yearly Drawdowns
It’s been a negative start to the first week of the year in the stock markets. I’ve seen a few posts analysing the significance of a first week down on the rest of the year – essentially none.
My last post talked about the difficulty in making Predictions for the new year, however I think it is always helpful to look at the range of outcomes in the past. One of my favourite charts looking back at past returns is from JP Morgan’s quarterly Guide to the Markets showing yearly return for the S&P 500 (grey bar) overlaid with the max drawdown experienced intra-year (red points).
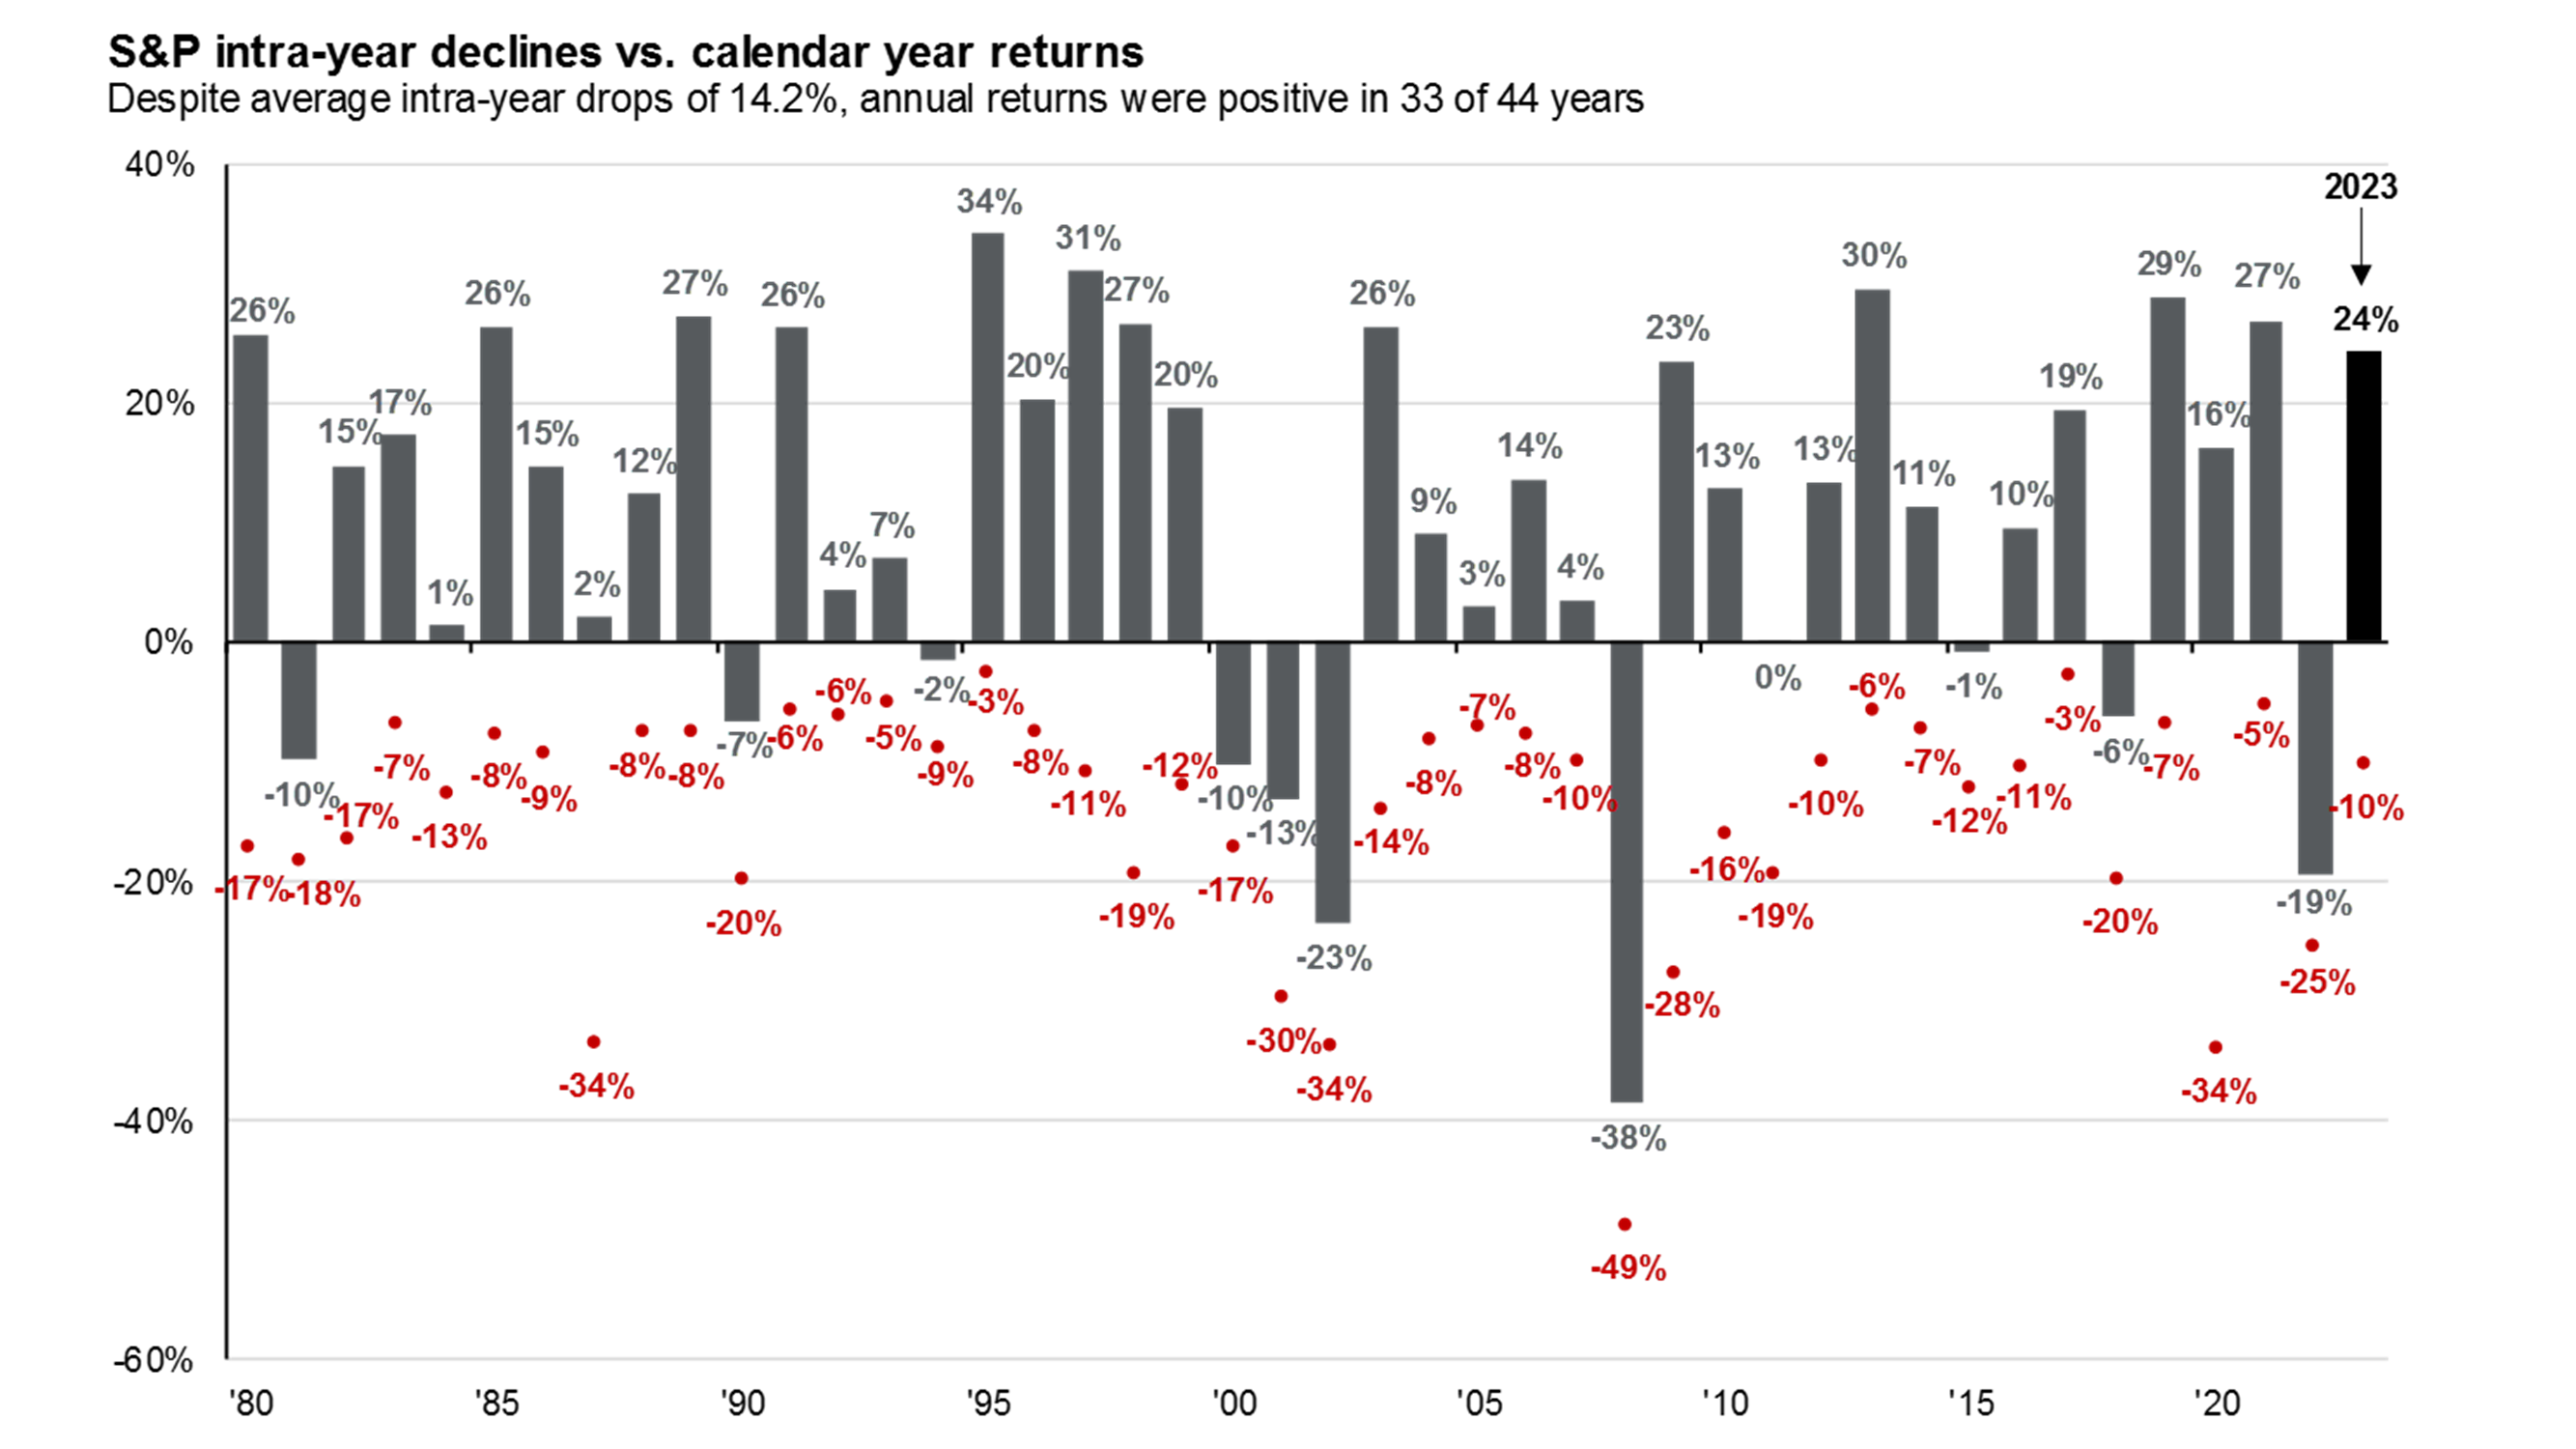
What this chart highlights is that despite mostly positive yearly returns, quite often there are significant intra-year drawdowns that need to be endured to get there. Stocks often pull back 5%, 10%, 15% and still end the year positive. They often pull back these amounts multiple times and still end the year positive. The fact that this is normal is something to consider when developing your trading and investing strategy for the year ahead.